
Over the past 25 years, the median house value nationally has risen by 412%, or $459,900.
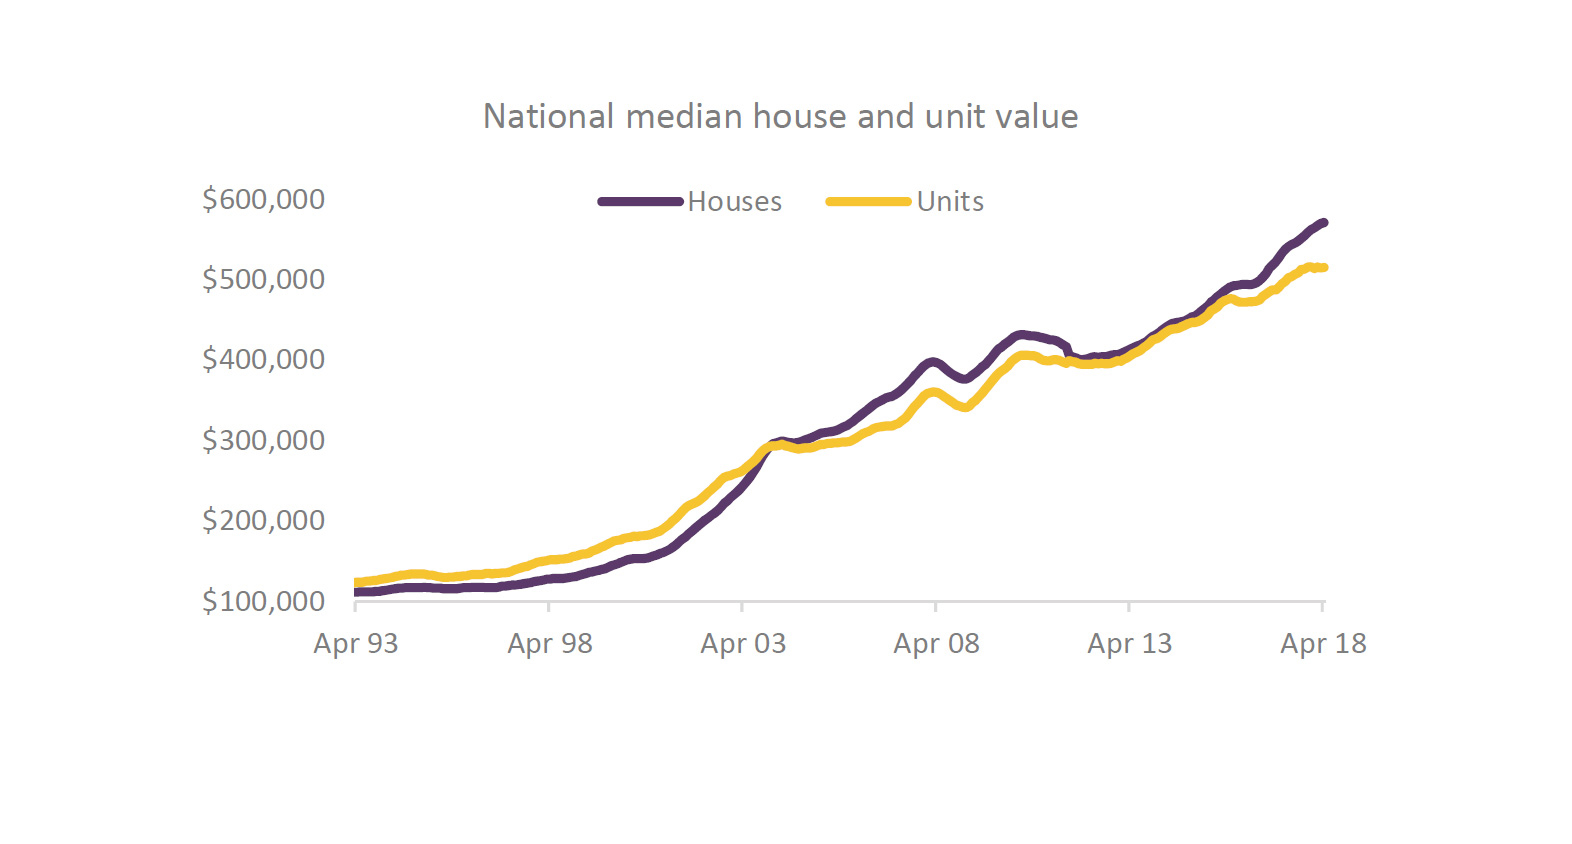
Twenty five years ago, the median house value across Australia was just $111,524 and units showed a slightly higher median value, at $123,840.
Since 1993, median house and unit values have increased by 412% and 316% respectively, providing home-owners with a significant wealth boost.
The capital gain over the past 25 years equates to an annual growth rate of 6.8% for houses and 5.9% for units and in dollar value terms.
The median value of the typical Australian house has risen by $459,900 since 1993 and unit values are $392,000 higher.
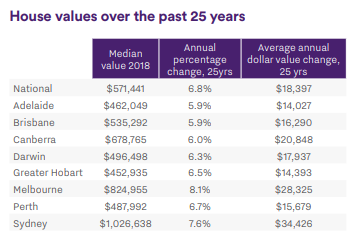
But, as always…long term annual capital gains have been reasonably diverse across the capital cities, with growth in house values ranging from 5.9% per annum in Adelaide and Brisbane to 8.1% in the Melbourne property market.
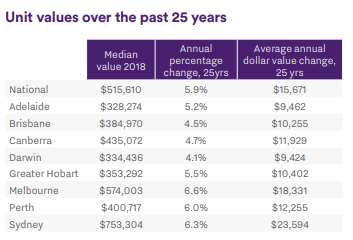
Across the capital city unit markets, annual growth rates have ranged from 4.1% in Darwin to 6.6% in Melbourne.
In dollar terms, the Sydney property market stands out, with the average annual increase in house and unit values equating to $34,426 and $23,594 per annum respectively over the past twenty five years.
The diversity in growth rates over a long period of time highlights the cyclical nature of the housing market, with dwelling values rising at different speeds from region to region and period to period.
For example, despite the Brisbane housing market recorded one of the lowest rates of annual capital gains, the period between 2001 and 2004 saw Brisbane house values rising at more than 10% per annum; the lower rate of long term growth is largely attributable to softer conditions since 2010.
Demonstrating the difference in values between now and 25 years ago, in 1993, 98% of all house sales nationally transacted at a value under $400,000 and only 0.2% sold for more than $1 million.
Over the past twelve months, only 29% of houses nationally sold for less than $400,000 and 16% sold for at least $1 million.
Across Australia’s highest priced capital city, Sydney, twenty five years ago only 0.8% of houses sold above the $1 million mark, whereas over the past year 50% of all house sales had a price tag of at least $1 million.
What could the future hold?
If property prices were to rise at the same rate as the past twenty five years, Australia’s median house value would reach $2.9 million by 2043.
While the past isn’t always the best predictor of the future, it’s a worthwhile benchmark to consider where housing values may be twenty five years from now.
Based on national house values rising at the annual rate of 6.8% per annum over the past quarter of a century, in 2043, the national median house value would be approaching the $3 million mark ($2.93) and the median unit value would be just over $2.1 million ($2.15).
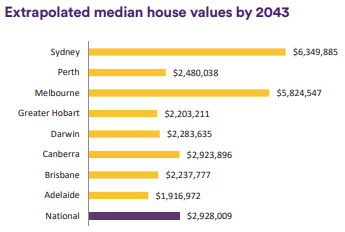
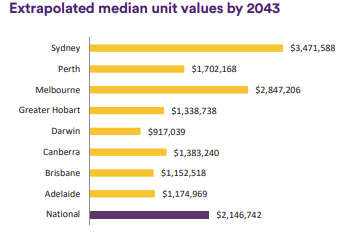
While it’s hard to fathom, if we saw the same rate of capital gains as what was recorded over the past twenty five years, Sydney’s median house value would be $6.35 million in 2043 and the typical unit would be worth $3.47 million.
Melbourne’s median house value would be approaching $6 million ($5.82) while the median house value in Brisbane would be $2.24 million.
Obviously these simple extrapolations don’t take into account how economic and demographic conditions might play out over the next twenty five years or how housing demand and supply may evolve; so there is a real possibility that housing trends and growth rates could look remarkably different to what we’ve seen over the past twenty five years.
Some more interesting findings from the Aussie Homes Loans Report:
Strong housing market conditions have boosted household wealth over the past quarter of a century.
The housing market has shown some extraordinary changes over the past twenty five years, with conditions moving through five distinct growth cycles which have pushed national median house values 412% higher.
Over the same period, the ASX All Ordinaries index has risen by a substantially lower 261%.
While value growth has been remarkably diverse across the country, over such a long period of time, the cyclical differences in value growth and turnover have washed their way through the statistics.
Each of the capital cities have recorded annual growth in house values ranging from 5.9% to 8.1% over the past 25 years, while regional markets have generally shown a slightly softer outcome.
Twenty five years ago the typical house value nationally was just $111,500 and since that time values have risen by an average of 6.8% per annum to the current level of $571,400.
The typical Australian property owner who has held their house for the past 25 years would have seen an average dollar value increase of almost $18,400 per annum.
Of course, different regions have seen housing conditions track at different speeds.
The largest annual increase in housing values within a capital city over the past twenty five years has been in Melbourne where values have increased at the annual rate of 8.1% per annum.
Over the past twenty five years Melbourne house values have moved through seven periods where annual capital gains exceeded 10% per annum.
More recently, the Melbourne housing market has been in a mild downturn, highlighting that property values don’t always rise, but over a long term the cyclical nature of housing markets will typically provide a wealth boost.
Conversely, the lowest long term capital gains have been in Adelaide and Brisbane, where house values have risen at the annual rate of 5.9%.
The diversity in growth rates over a long period of time highlights the cyclical nature of the housing market, with dwelling values rising at different speeds from region to region and period to period.
For example, despite Brisbane recording one of the lowest rates of annual capital gains, the period between 2001 and 2004 saw Brisbane house values rising at more than 10% per annum; the lower rate of long term growth is largely attributable to softer conditions since 2010.
The average mortgage size has grown roughly at the same rate as housing values
With dwelling values moving higher, the average loan size has also shown a substantial increase.
In 1993 the average owner occupier loan size nationally was $81,500 and the figure has since risen to $388,100; an increase of 376%.
Twenty five years ago, borrowers in the ACT were holding the largest loans, averaging almost $97,000, however in today’s market the largest average loan sizes can be found in New South Wales ($445,500) and Victoria ($400,200).
Mortgage rates have reduced significantly since 1993.
Twenty five years ago mortgage rates were moving lower from their record highs.
Variable mortgage rates peaked at 17.0% in March of 1990 and by first quarter of 1993 they had reduced to 10.0%.
Today, the standard variable mortgage rate sits at 5.2%, the lowest rate since the 1960’s.
Mortgage serviceability rates have improved thanks to historically low interest rates, however affordability challenges remain.
The proportion of annual household income required to service a mortgage (based on a 20% deposit, a 25 year principal and interest mortgage and the average discounted variable mortgage rate) is currently tracking at approximately 36% compared with a recent peak of 51% of annual household income being dedicated to servicing a mortgage in June of 2008.
Although CoreLogic serviceability measures don’t extend back twenty five years, sixteen years ago, serviceability measures were lower despite mortgage rates being approximately 130 basis points higher.
With dwelling values rising most substantially in Sydney and Melbourne over the past two growth cycles, households are dedicating a larger portion of their annual incomes to servicing their mortgage repayments.
Households in Sydney are generally dedicating the largest proportion of their annual incomes to service a mortgage (49.3%) with Melbourne close behind at 42.6%.
Affordability is still a significant issue
The dwelling price to income ratio rose to new record highs in 2017 due to housing prices rising at a faster pace than household incomes.
This worsening trend in affordability was largely driven by the largest capital cities, Sydney and Melbourne, where housing values have shown the most significant increase.
Sydney’s dwelling price to income ratio is now tracking at 9.3, which means the typical Sydney dwelling now costs 9.3 times more than the median annual household income.
Affordability pressures are likely to be most pronounced across those segments of the market who have tighter budgetary constraints such as first time buyers who haven’t had the benefit of accruing equity in the housing market, and low income households.
Nationally, in order to raise a 20% deposit to buy a dwelling, households would need to dedicate an average of 134.5% of their annual gross income.
The proportion of household income required for a 20% deposit is substantially higher in those markets where value growth has been strongest over the past five years.
In Sydney, households would need to dedicate an average of 185.1% of their annual household income to raise a 20% deposit, while in Melbourne the figure is slightly lower at 159.7%.
Based on these numbers, households will generally require several years to raise a 20% deposit.
Anecdotally, more first time buyers are seeking assistance from benefactors such as their parents or siblings in order to enter the housing market with as large a deposit as possible.
First homebuyers make up a smaller component of housing demand
As dwelling values have shifted higher and affordability has become more challenging, first home buyers have found it harder to participate in the market.
Twenty five years ago, first time buyers accounted for approximately 22% of all owner occupier housing finance commitments.
While that proportion remained reasonably consistent until the year 2000, first home buyer participation in the market has generally been in decline since that time.
The exception has been periods of first home buyer stimulus, where grants and stamp duty concessions have been generous, first time buyer numbers have surged.
The current statistics indicate that first home buyers represent 17.4% of all owner occupier housing finance commitments, rising from a recent low point of 12.9% in late 2015.
Recent stamp duty concessions in New South Wales and Victoria have been a key driver of the rebound in first home buyer participation, while every state and territory has some form of incentive available for first home buyers, typically with greater incentives available for those building or purchasing a new property or those purchasing outside of the capital city.
Investors have become a larger component to housing demand
Investment trends have generally moved in the opposite direction of first home buyers, with investors becoming a larger component of housing demand over the past twenty five years.
In 1993, housing finance commitments for investment purposes accounted for only 20% of the market.
Fast forward to 2015, and investors as a proportion of housing finance reached an historic high, comprising 55% of the value of all new housing finance commitments.
Since that time there have been regulatory changes imposed by the prudential regulator, APRA, which has slowed investor participation in the market.
The latest data to March 2018 shows investors still comprise 42.8% of mortgage demand, more than double the proportion from twenty five years ago.
Urban density has increased as our population grows
The growth in property values over the past twenty five years has happened against a backdrop of ongoing densification across the capital cities, with higher density housing stock rising in prominence due to changes in town planning policies, changing consumer preferences and affordability factors.
Twenty five years ago, only 22.7% of all dwelling sales nationally were for units.
In today’s market units comprise 29.6% of all sales and in some cities where the densification trend has been more pronounced, higher density dwellings account for more than 40% of all sales.
Another example of the densifying urban landscape over the past twenty five years has been the reduction in vacant land block sizes.
In 1993 the average block size based on vacant lands sales nationally was 816sqm.
Developers have progressively reduced the typical block size over time to reach 541sqm in 2015 before land areas started edging higher to the current average size of 610sqm.
Across the capital cities, block sizes are generally smaller than the national average due to the scarcity of land and zoning regulations which allow for higher densities.
Adelaide and Perth show the smallest lot sizes, averaging approximately 379sqm and 375sqm respectively.
It’s still hard to imagine what property values in our future cities will look like.
If home values increase at the same annual rate as they have over the past twenty five years we will see a median dwelling value nationally of $2.9 million by the year 2043.
While that value looks astronomically high in today’s money, if the historic averages play out over the next twenty five years, Sydney values would be breaking the $6.3 million mark and Melbourne would be over $5.8 million.
One thing that is certain is that housing markets will continue to move through their cycles, with periods of growth, decline and steady values conditions.
History has shown that over time these cycles tend to smooth out the year to year volatility in growth rates.
A good example of this is the Melbourne housing market, which has shown the highest long term rate of capital gain, however house values in this city have been through five separate periods where values were declining on an annual basis over the past twenty five years.
Cities will continue to densify as the population grows and urban planning strategies seek to maximize the use of strategically located land and transport corridors, which means more Australians are likely to be living in higher density housing.
Innovative housing design is likely to increase in importance, with small living areas becoming more acceptable thanks to smarter design principles and better use of space.
With technology progressing at a rapid pace, there are likely to be more households taking advantage of flexible working arrangements where they can work remotely with rapid and reliable internet speeds, affordable telecommunications and less requirement to commute into a centrally located place of work.
This may see some housing demand deflected to the markets outside of the capital city boundaries where housing tends to be more affordable.
Additionally, with the eventual advent of driverless cars and rapid transit systems, commuting times from areas that were once considered to be outside of a comfortable travel range may become more popular with home-owners, thereby reducing demand to live close to the major working centres of the city.
There are likely to be a plethora of other evolutions in the housing market and housing demand that remain beyond the imagination.
It was less than ten years ago that the first iPhone was released and roughly twenty five years ago dial-up internet was only just becoming popular.
The likelihood is that advances in technology will continue to accelerate, promoting innovation in how we live and work.
Only time will tell, but the next twenty five years will certainly be an interesting ride.
But what we can be sure of is that the best investment locations will be in close proximity (say 10 – 20 km) to our 3 big east coast capital cities as the more affluent new generation of home buyers push up the values of well located properties, while the less affluent will be pushed further and further out from the main centres.
